可視化
EasyBenchには様々な可視化オプションがあり、ベンチマーク結果をグラフ形式で表現できます。
Note
可視化を行うためには、matplotlibをインストールする必要があります:
pip install matplotlib
seabornエンジンを使用する場合は、seabornもインストールしてください:
pip install seaborn
可視化レポーター
可視化を行うには、文字列で指定するか、各種フォーマッターをPlotReporterに入力して使用します:
| matplotlibベース | seabornベース | フォーマッター | 説明 |
|---|---|---|---|
"boxplot" |
"boxplot-sns" |
BoxPlotFormatter |
ボックスプロットによる可視化 |
"violinplot" |
"violinplot-sns" |
ViolinPlotFormatter |
バイオリンプロットによる可視化 |
"lineplot" |
"lineplot-sns" |
LinePlotFormatter |
ラインプロットによる可視化 |
"histplot" |
"histplot-sns" |
HistPlotFormatter |
ヒストプロット(ヒストグラム)による可視化 |
"barplot" |
"barplot-sns" |
BarPlotFormatter |
バープロットによる可視化 |
共通の可視化パラメータ
すべての可視化フォーマッターで利用可能な主なパラメータ:
figsize: グラフのサイズ(デフォルト:(10, 6))log_scale: 対数スケールを使用するかどうか(デフォルト:False)engine: プロットエンジン("matplotlib"(デフォルト) または"seaborn")sns_theme: seabornテーマ設定辞書(例:{"style": "darkgrid", "palette": "Set2"})
また、各種フォーマッターでは、指定したエンジンの対応する描画関数のパラメータも受け取ることができます (例: BoxPlotFormatterでseabornエンジンを使用する場合、seaborn.boxplotのlinewidthオプションなども指定可能)。
可視化オプション
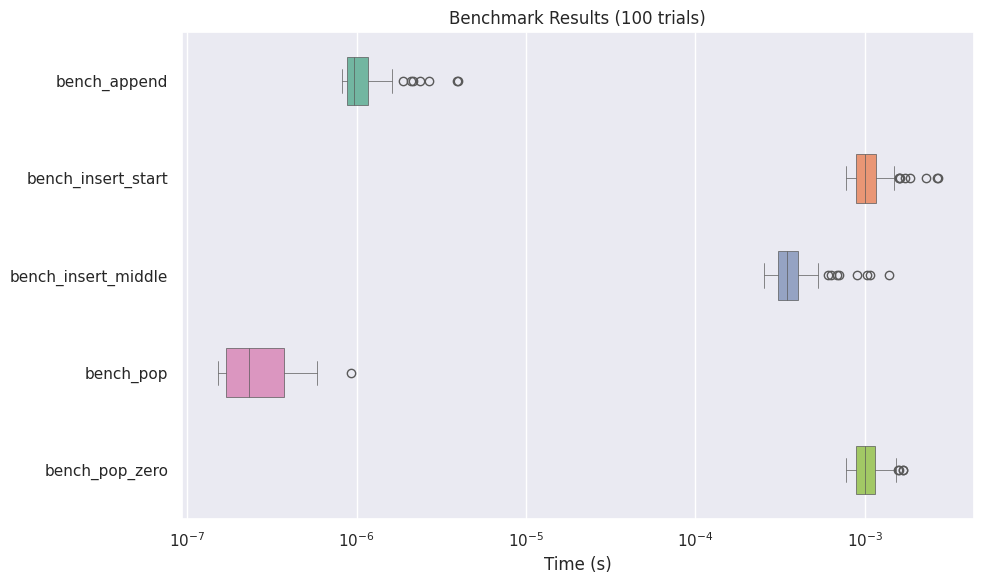
ボックスプロット (BoxPlotFormatter)
(APIリファレンス: BoxPlotFormatter, matplotlib, seaborn)
ベンチマーク結果をボックスプロットとして可視化します:
from easybench import BenchConfig, EasyBench, customize
from easybench.visualization import BoxPlotFormatter, PlotReporter


class BenchList(EasyBench):
    bench_config = BenchConfig(
        trials=100,
        warmups=100,
        loops_per_trial=100,
        reporters=[
            "console",  # 通常のコンソール出力も含める
            PlotReporter(
                BoxPlotFormatter(
                    showfliers=True,           # 外れ値を表示
                    log_scale=True,            # 対数スケールを使用
                    engine="seaborn",          # プロットエンジンとしてseabornを使用
                    orientation="horizontal",  # 水平または垂直の向き
                    width=0.5,                 # ボックスの幅 (seaborn専用)
                    linewidth=0.5,             # 線の幅 (seaborn専用)
                ),
                show=True,                     # グラフを画面に表示
                save_path="benchmark_results.png",  # 画像ファイルとして保存
                dpi=150,                       # 画像の解像度
            ),
        ],
    )

    def setup_trial(self):
        self.big_list = list(range(1_000_000))

    @customize(loops_per_trial=1000)
    def bench_append(self):
        self.big_list.append(-1)

    def bench_insert_start(self):
        self.big_list.insert(0, -1)

    def bench_insert_middle(self):
        self.big_list.insert(len(self.big_list) // 2, -1)

    @customize(loops_per_trial=1000)
    def bench_pop(self):
        self.big_list.pop()

    def bench_pop_zero(self):
        self.big_list.pop(0)


if __name__ == "__main__":
    BenchList().bench()
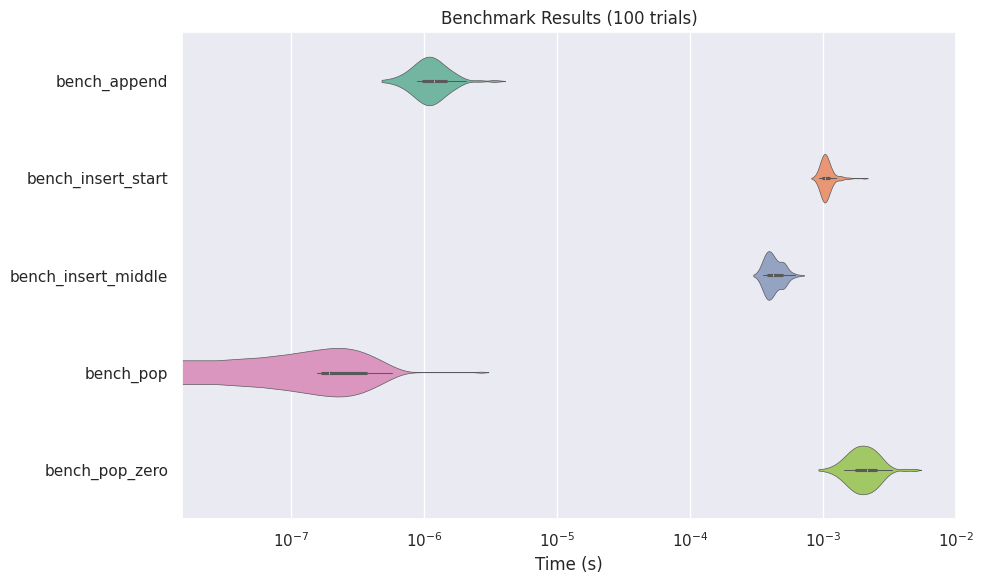
バイオリンプロット (ViolinPlotFormatter)
(APIリファレンス: ViolinPlotFormatter, matplotlib, seaborn)
バイオリンプロットはデータの分布をより詳細に表示します:
from easybench import BenchConfig
from easybench.visualization import ViolinPlotFormatter, PlotReporter

# 設定例
bench_config = BenchConfig(
    trials=100,
    reporters=[
        "console",
        PlotReporter(
            ViolinPlotFormatter(
                log_scale=True,
                inner="box",  # 内部表示形式 (seaborn専用)
                cut=2,        # 分布のカット位置 (seaborn専用)
                engine="seaborn",
                ...
            ),
            save_path="violin_results.png",
        ),
    ],
)
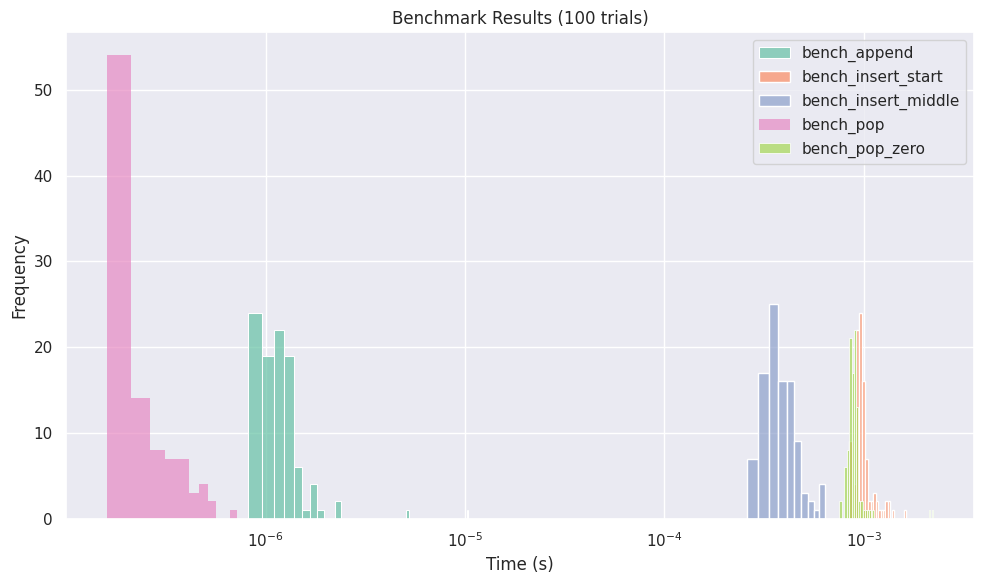
ヒストグラム (HistPlotFormatter)
(APIリファレンス: HistPlotFormatter, matplotlib, seaborn)
ベンチマーク結果の分布をヒストグラムで表示します:
from easybench import BenchConfig
from easybench.visualization import HistPlotFormatter, PlotReporter

bench_config = BenchConfig(
    trials=100,
    reporters=[
        "console",
        PlotReporter(
            HistPlotFormatter(
                bins=10,           # ビンの数
                kde=False,         # カーネル密度推定を表示 (seaborn専用)
                engine="seaborn",
                ...
            ),
            save_path="histogram_results.png",
        ),
    ],
)
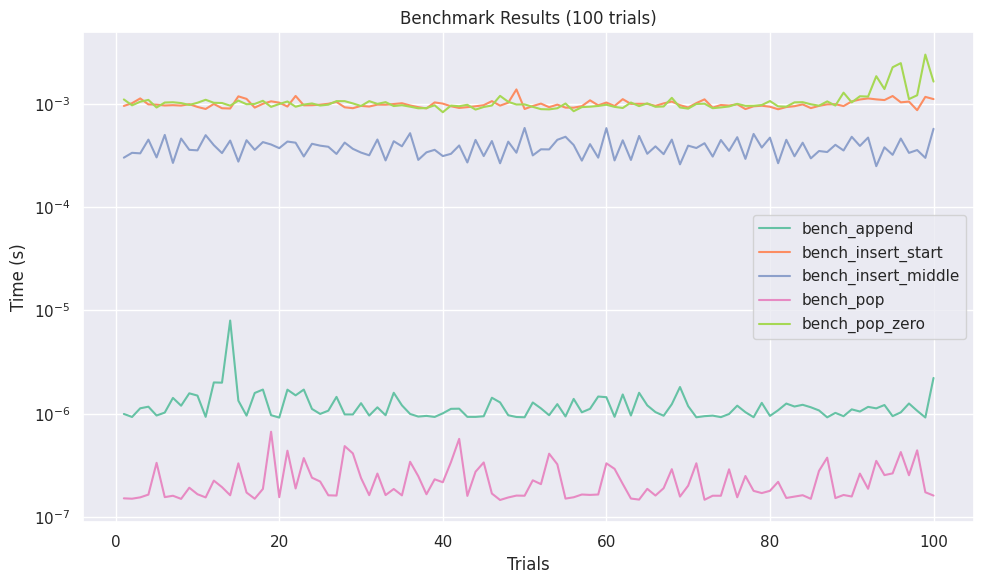
ラインプロット (LinePlotFormatter)
(APIリファレンス: LinePlotFormatter, matplotlib, seaborn)
ベンチマーク結果の推移を可視化します:
from easybench import BenchConfig
from easybench.visualization import LinePlotFormatter, PlotReporter

bench_config = BenchConfig(
    trials=100,
    reporters=[
        "console",
        PlotReporter(
            LinePlotFormatter(
                engine="seaborn",
                markers=False,  # マーカーの設定 (seaborn専用)
                dashes=False,   # ラインの設定 (seaborn専用)
                ...
            ),
            save_path="line_results.png",
        ),
    ],
)
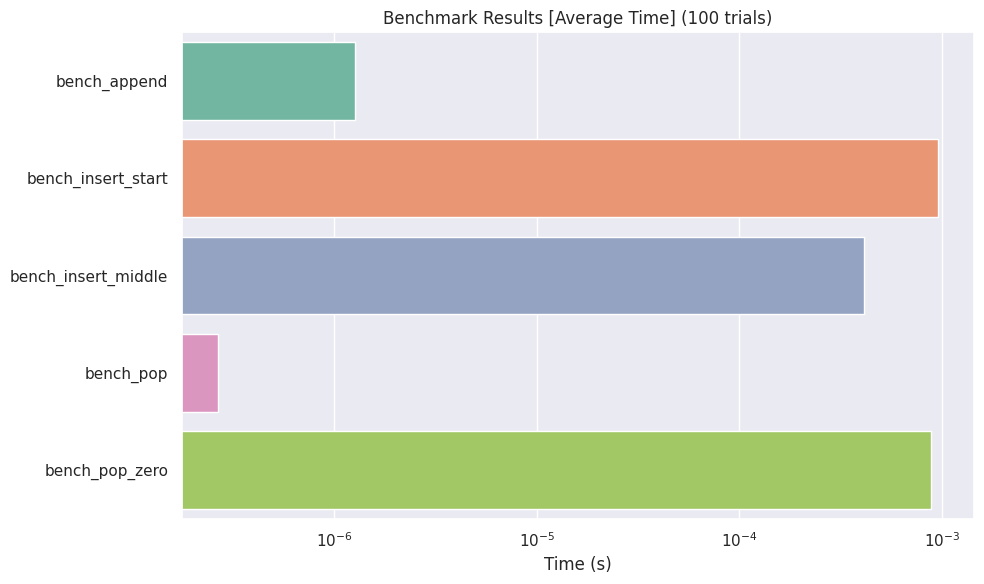
バープロット (BarPlotFormatter)
(APIリファレンス: BarPlotFormatter, matplotlib, seaborn)
各ベンチマーク結果を棒グラフで表示します:
from easybench import BenchConfig
from easybench.visualization import BarPlotFormatter, PlotReporter

bench_config = BenchConfig(
    trials=10,
    reporters=[
        "console",
        PlotReporter(
            BarPlotFormatter(
                log_scale=True,
                metric="avg",      # 表示する統計量("avg", "min", "max")
                engine="seaborn",
                ...
            ),
            save_path="bar_results.png",
        ),
    ],
)
可視化のカスタマイズ
より詳細なカスタマイズについては、PlotReporterと各*PlotFormatterクラスのオプションを参照してください。また、独自の可視化フォーマッタを作成する方法はReporterやFormatterを自作するを参照してください。